

Supporting Child Nutrition with the New Growth Chart Plugin for DHIS2
At Devotta, we believe in building tools that make a difference in the real world.
That’s why we’re excited to share the release of a new plugin for DHIS2: the Growth Chart plugin, designed to support child nutrition programs through clear, customizable visualizations of growth indicators.
This plugin was developed as part of a student internship project in collaboration with NTNU’s bachelor program in Digital Infrastructure and Cyber Security, and has now been published on the DHIS2 App Hub.
A Tool for Global Use, Built with Local Needs in Mind
Child growth monitoring is a core part of public health and nutrition strategies. Whether it's early detection of undernutrition or tracking recovery over time, visualizing anthropometric indicators can make a critical difference for health workers and program managers.
The Growth Chart plugin:
- Uses World Health Organization (WHO) growth references by default
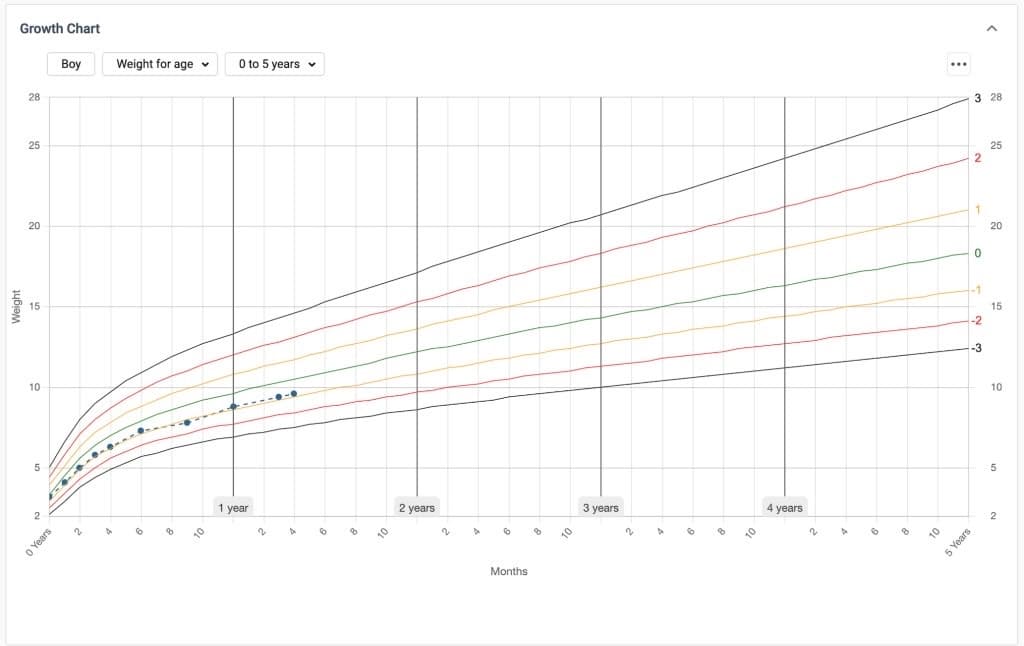
- Plots height-for-age, weight-for-age, and weight-for-height curves
- Is fully configurable, allowing countries to use their own growth standards
- Integrates directly into Tracker programs, tied to each enrolled child
The plugin is generic, lightweight, and designed to work in both online and offline settings.
How to Use the Plugin
- Install from the DHIS2 App Hub
Visit the App Hub and install the plugin on your DHIS2 instance. - Add it to your Tracker program
The plugin is an Enrollment Widget. Once installed, administrators can add it to any Tracker program through the “Program Configuration” settings. - Set your growth reference
By default, the plugin uses WHO standards. You can customize this by uploading your own reference data for percentile curves. - Start using it in the field
Health workers will see a chart embedded directly in the Capture interface, showing growth trends over time for each child.
Documentation and configuration support are available on the DHIS2 developer portal.
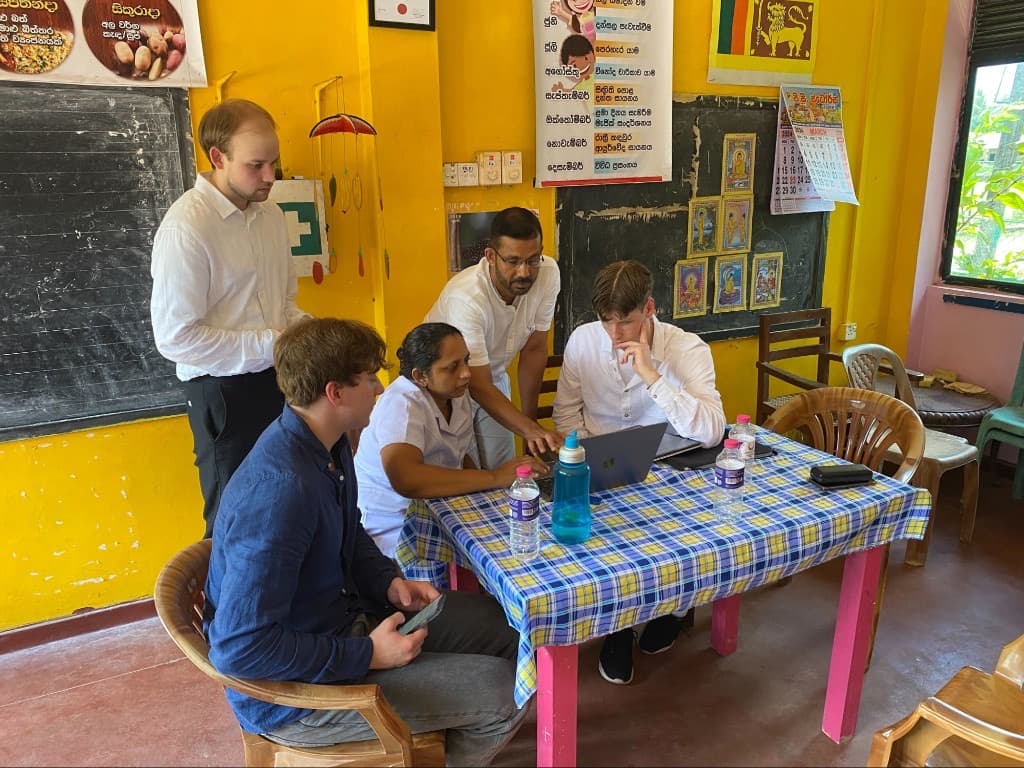
Built as part of the Devotta Internship program. Field-Tested in Sri Lanka.
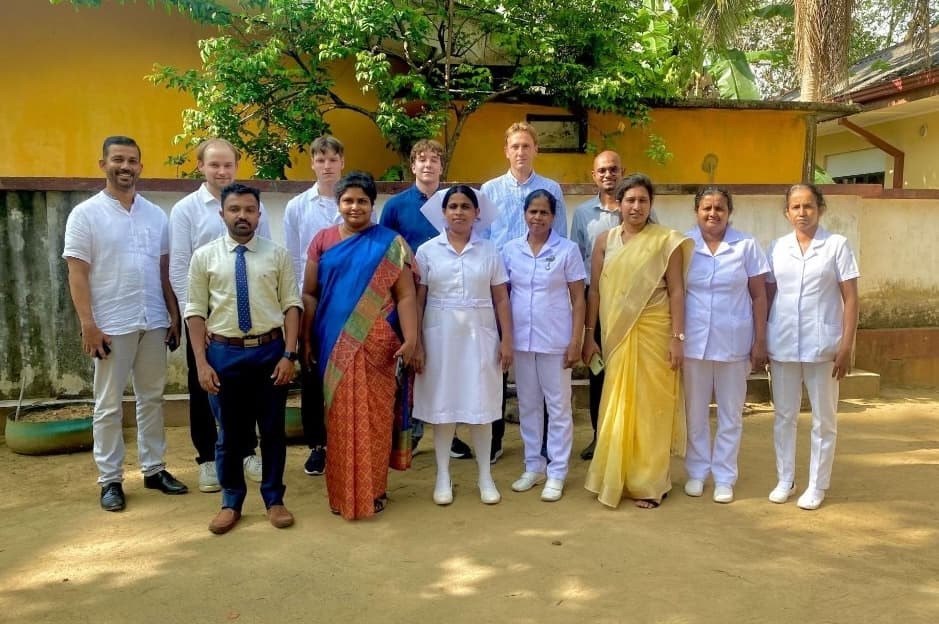
The plugin was developed by Petter Aleksander Vestby, Henrik Moen Vadet, and Edvin Aamot Stava during their bachelor internship at Devotta. As part of the process, they worked closely with HISP MENA and conducted real-world field testing with HISP Sri Lanka, receiving feedback from users on the ground and making iterative improvements.
This project demonstrates the power of applied learning and the value of our internship program, where students work on real tools with real users, not just as an academic exercise, but as contributors to digital public goods that are used globally. You can read their Bachelor’s thesis here.

“It has been an incredible experience to know that the work we did for our bachelor’s thesis is being used by several countries to improve child nutrition.”
Devotta Intern
We would like to thank:
- HISP MENA and HISP Sri Lanka, for technical guidance and field validation
- Innlandet fylkeskommune and the FORREGION program, for enabling the field trip
- NTNU, for facilitating the partnership
- And of course, the health workers who tested and shaped the plugin
Want to implement the plugin or learn more about our internship program?